


This map shows the 100 largest US cities and how well they are performing on meeting the United Nation’s Sustainable Development Goals by 2030. Chicago ranks 71st on the list.
This is one of several maps and charts included in a report titled Leaving No US City Behind: The U.S. Cities Sustainable Development Goals Index. Find link to the pdf here.

Last Saturday protesters in Chicago shut down the Dan Ryan Expressway for a few hours to protest violence in the city. I created these map views for a follow-up blog article to illustrate how faith groups and others could create a neighborhood-based planning process intended to help reduce violence in different parts of the city and suburbs.
In the article I also included the concept map shown below, which includes links to different sub sections of a web library that I’ve been building since the mid 1990s:
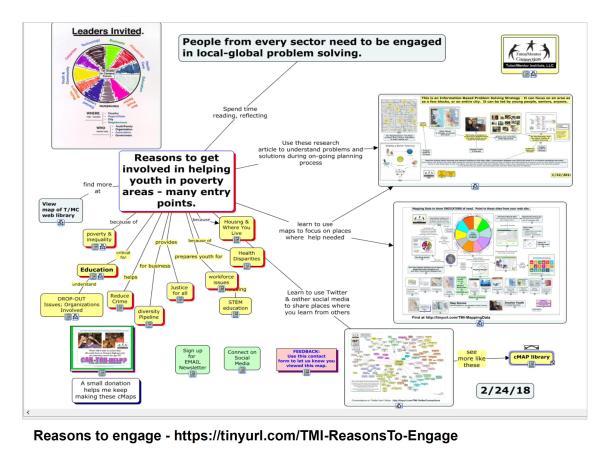
I added the article US cities to my library as one more piece of information people need to be looking at as they gather and innovate solutions to complex, wicked problems that persist in Chicago and other US cities.
What’s needed are leaders who use the visibility of their protests to draw people into web libraries for deeper learning, then into on-line and face to face discussion forums where they look for ways to apply what they learn in solutions they apply in different neighborhoods and cities.
I’ve posted many articles with this information-based problem solving strategy on this blog and in the Tutor/Mentor blog.
Anyone can create a map like I’ve done, using existing data platforms, then create blog articles like mine, that attempt to mobilize growing numbers of stakeholders to be involved in finding solutions.
If you’re doing this, share your link in the comment section, or via a post to @tutormentorteam on Twitter.
